Showing posts with label Pemrosesan Sinyal Akustik. Show all posts

Monday, April 13, 2015

How-to: Measure Impulse Response with Aliki

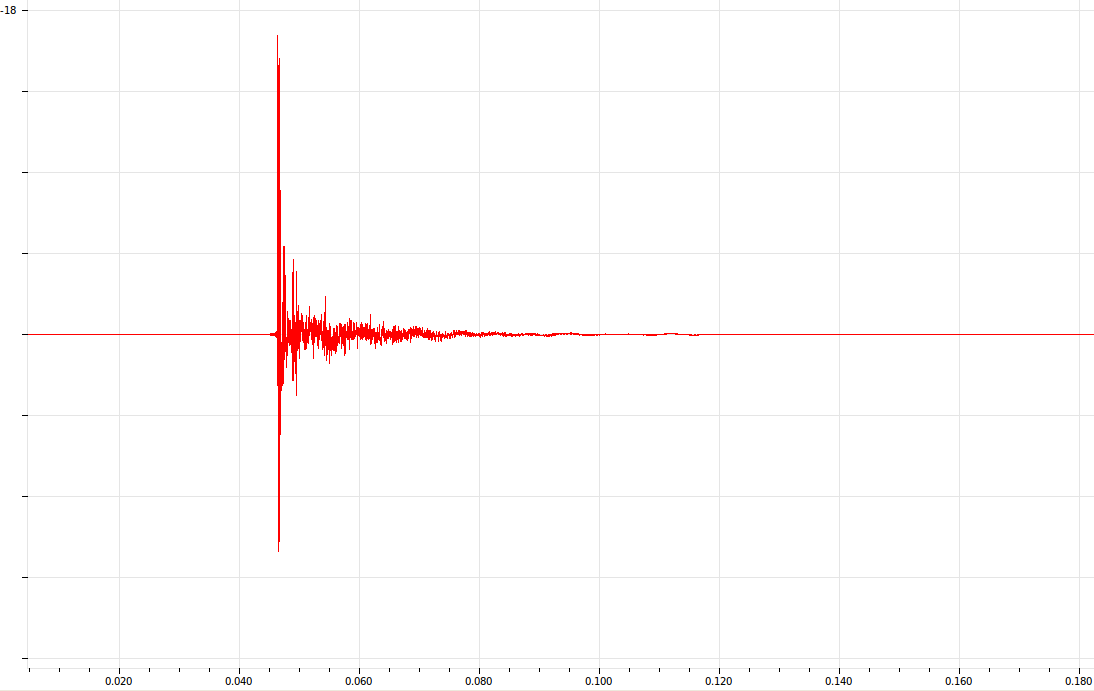
Aliki is software to measure room impulse response. It's free and open source. On a dynamic system, impulse response is its output(response) when presented with a brief input signal (impulse). For room acoustic, impulse response can be used to measure acoustic characteristics like reverberation time, early decay time, later decay time and speech intelligibility.

How to measure room impulse response? Here is how, with a software called Aliki (free and open source).

Impulse response of semi-anechoic room in VibrasticLab

Installation

In Ubuntu, it is easy to install Aliki using apt-get:
sudo apt-get install aliki
It will install Aliki (gui) and its dependencies.

Step-by-step :

Sunday, April 12, 2015

Wavplot and Wavplay

Matlab has their built in function to play .wav file, but it didn't work in Unix and Linux-based OS, because the wavplay function only supported in Windows. Moreover, I want to plot waveform of .wav file in single command, so I don't need to wavread it before plot. For those two purposes, I made two shorts function namely wavplot and wavfile.

Wavplot
wavplot is simple function to plot .wav file. Why I need it? because I continuously working with .wav file, and I want to plot it directly to get information of sound file via its waveform. Here the code of wavplot function.

function wavplot(wavFile)
% wavplot(wavFile) plot waveform and spectrum of wav file
% bagus@ep.its.ac.id

if nargin>1
    fprintf('Usage: wavplot(wavFile \n');
    return;
end;

[y, fs]=wavread(wavFile);
plot(y)
end

How to use it? it is simple. If you have .wav file, for example it has name tone.wav and you are in the current directory of Matlab command window, you can directly plot it with this function,
wavplot('tone.wav')
And it will plot the wav file like the following,
Output of wavplot function

Sunday, March 30, 2014

Memfilter Sinyal Suara Pada Range Frekuensi Tertentu (Bandpass) dengan Matlab / Octave + Python

Buka - buka file lama di folder kuliah S1 Teknik Fisika, saya menemukan file script matlab yang saat itu dimintai tolong seorang teman untuk mengerjakan Tugas Akhirnya. Script ini untuk memfilter sinyal (suara) pada frekuensi tertentu dengan menggunakan bandpass filter, yakni gabungan antara low pass filter dan high-pass filter.

Misalnya kita mempunyai sinyal suara dengan frekuensi 0 - 20000 Hz, namun karena suatu hal (misalnya noise) kita cuma butuh sinyal di frekuensi 700 - 1400 Hz saja, maka kita bisa menggunakan script matlab / octave ini. Script ini berjalan lancar baik pada Matlab maupun GNU Octave.

Gambar spectrogram di bawah ini membandingkan spectrogram sinyal sebelum difilter dan setelah difilter. Script untuk GNU / Octave ada di bawahnya.

Sinyal Sebelum di filter
Sinyal Setelah di filter

Berikut script kode Octave / Matlab (link Github disini).
% demo program untuk memfilter suara pada range fekuensi oktaf tertentu
% by bagustris bagustris@linuxmail.org
% adopted from somewhere (forget aka lupa)

% set general variables
clear all; close all; clc;
sf = 22050;  % sample frequency
nf = sf / 2; % nyquist frequency
d = 1.0;     % duration, ganti untuk merubah durasi suara
n = sf * d;  % number of samples
nh = n / 2;  % half number of samples

Monday, November 14, 2011

Find Local Peak of Signal in GNU Octave

The finding or searching the local peak is needed for some application such as fundamental frequency estimation, finding time delay or timelag or others. The following is a simple program to find the local peak of signal. The example of .wav sound signal

octave:1> [signal, fs] =wavread('signal.wav');    % read signal

octave:2> threshold=0.1;                          % limit the min. peak amplitude

octave for sig_ind = 1:4000
> if signal(sig_ind) > threshold
> x=sig_ind;
> break;
> endif
> endfor
octave:3> x
x = 3822

To give the display and find the rough peak of signal you can see from the figures of signal. The picture below comparing whole signal and the local signal from 1 to 4000 samples. To find the coordinate of local peak, just simply type

[a b]=max(signal(1:4000)

Full length signal and signal from 1 to 4000 samples

Tuesday, November 01, 2011

Pemisahan Banyak Sumber Suara Mesin Menggunakan Analisis Komponen Independen (ICA) Untuk Deteksi Kerusakan

Pemeliharaan kondisi mesin di industri membutuhkan kecepatan dan kemudahan, salah satu metodenya adalah dengan analisis getaran. Getaran mesin menyebabkan pola suara yang diemisikan mesin, di mana suara mesin satu bercampur dengan mesin lainnya. Blind Source Separation (BSS) merupakan teknik memisahkan sinyal campuran berdasarkan sifat kebebasan statistik antar sumber. Melalui simulasi dengan beberapa motor dan susunan mikrofon sebagai sensor didapatkan data suara campuran dari beberapa motor yang terekam melalui tiap mikrofon, di mana intensitas sinyal yang diterima mikrofon berbeda satu sama lain, tergantung pada jarak dan sudut datangnya. Tujuan penelitian ini adalah untuk memisahkan sinyal campuran dari tiap mikrofon sehingga didapatkan sinyal estimasi sumber untuk mendeteksi kerusakan motor. Berdasarkan hasil penelitian diperoleh pemisahan sinyal terbaik dalam Time-Domain ICA. Sinyal estimasi tersebut dianalisis untuk menentukan kondisi kerusakan mesin berdasarkan pola frekuensi sesaatnya. 

Full paper bisa di download disini, it's free. 
(Jurnal Ilmu Komputer dan Informasi, Fasilkom - UI, Februari 2011)
Pengantar tentang Blind Source Separation bisa dibaca disini.

Monday, October 10, 2011

Menghitung SNR dengan Matlab / Octave

SNR- Signal to Noise Ration adalah ukuran untuk membandingkan suatu sinyal dengan noise-nya. SNR didefinisikan sebagai perbandingan power signal dengan power noisenya. Gampangannya, kalau power sinyal yang kita inginkan lebih kecil daripada noisenya, maka  hasil kita jelek (hasil apapun, entah dalam speech enhacement, source separation, image processing atau yang lain). Sehingga, semakin besar nilai SNR tentunya semakin baik kualitas desired signal kita.
Sesuai formulanya, SNR dirumuskan sebagai berikut;
$$SNR=\dfrac{P_{signal}}{P_{noise}}$$
dimana P merupakan power rata-rata baik dari sinyal maupun noise yang diukur pada t yang sama dan dalam bandwith yang sama. Jika sinyal dan noise memiliki impedansi yang sama, maka SNR dapat dihitung dari kuadrat Amplitudo kedua sinyal dan noise tersebut. Agar mempunyai impedansi yang sama, pada praktek penghitungan SNR dengan matlab/Octave nilai SNR dinormalisasi dengan perintah norm
.
dimana A merupakan root mean square (rms) dari amplitudo sinyal. Karena banyak sinyal memiliki dynamic range, maka SNR dapat dinyatakan dalam decibel (dB) sebagai berikut: